Every business owner wants to make smart business decisions based on their data. But more often they lack the tools and end up making decisions based on their gut. The world of content marketing is quite the same. Without having the right data to back your decisions, creating and publishing content is like a shot in the dark.
You need to gather information about the market you’re venturing into, your target audience, your competitors and so much more. And just gathering data is not enough. You also need to draw actionable insights from them to support and scale your content marketing strategy.
If you scan the market, you will quickly realize that there are tons of tools that provide you with reports and data analytics. But the number of tools providing you insights based on this data is limited.
In today’s article, I will be covering one such unique tool that provides analytics as well as insights based on your data.
Let’s take a deep dive and understand Putler in detail in this article.
What is Putler
Putler, is a multichannel business analytics software. It aggregates data from multiple websites, payment gateways, purchase order software, shopping carts and Google analytics accounts in one place.
It is the only tool that provides you with reporting both for SaaS as well as eCommerce businesses.
You get in-depth reports on Products, Customers, Orders and your Website Traffic. Additionally, Putler also provides you insights, forecasts, goal tracking, segmentation and a lot more to continuously improve your sales strategy, communication, customer service and other areas of business.
Main features of Putler:
- Provides analytics for SAAS as well as Non – SAAS businesses
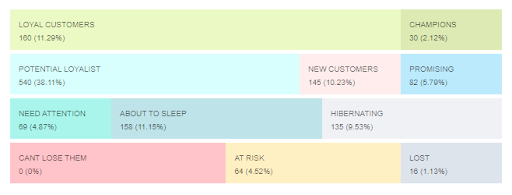
- Provides RFM Customer Segmentation
- Instant transaction lookup.
- Customer profiling and purchase history
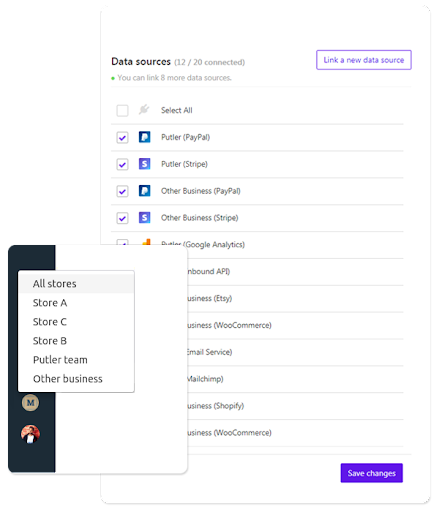
- Multi-store reporting
- Automatic de-duplication, enrichment, currency, and timezone conversion.
- 153+ key performance indicators and reports.
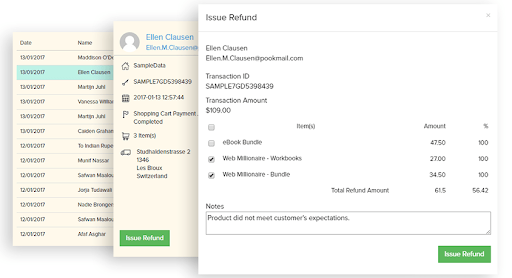
- Issue refunds, and manage subscriptions.
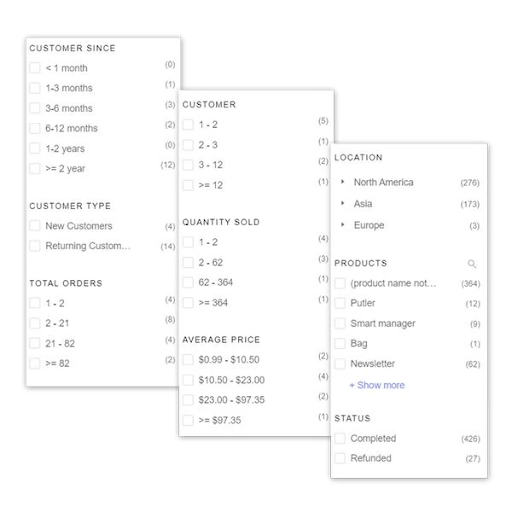
- Intuitive filters
- Custom segments
Putler’s Dashboards
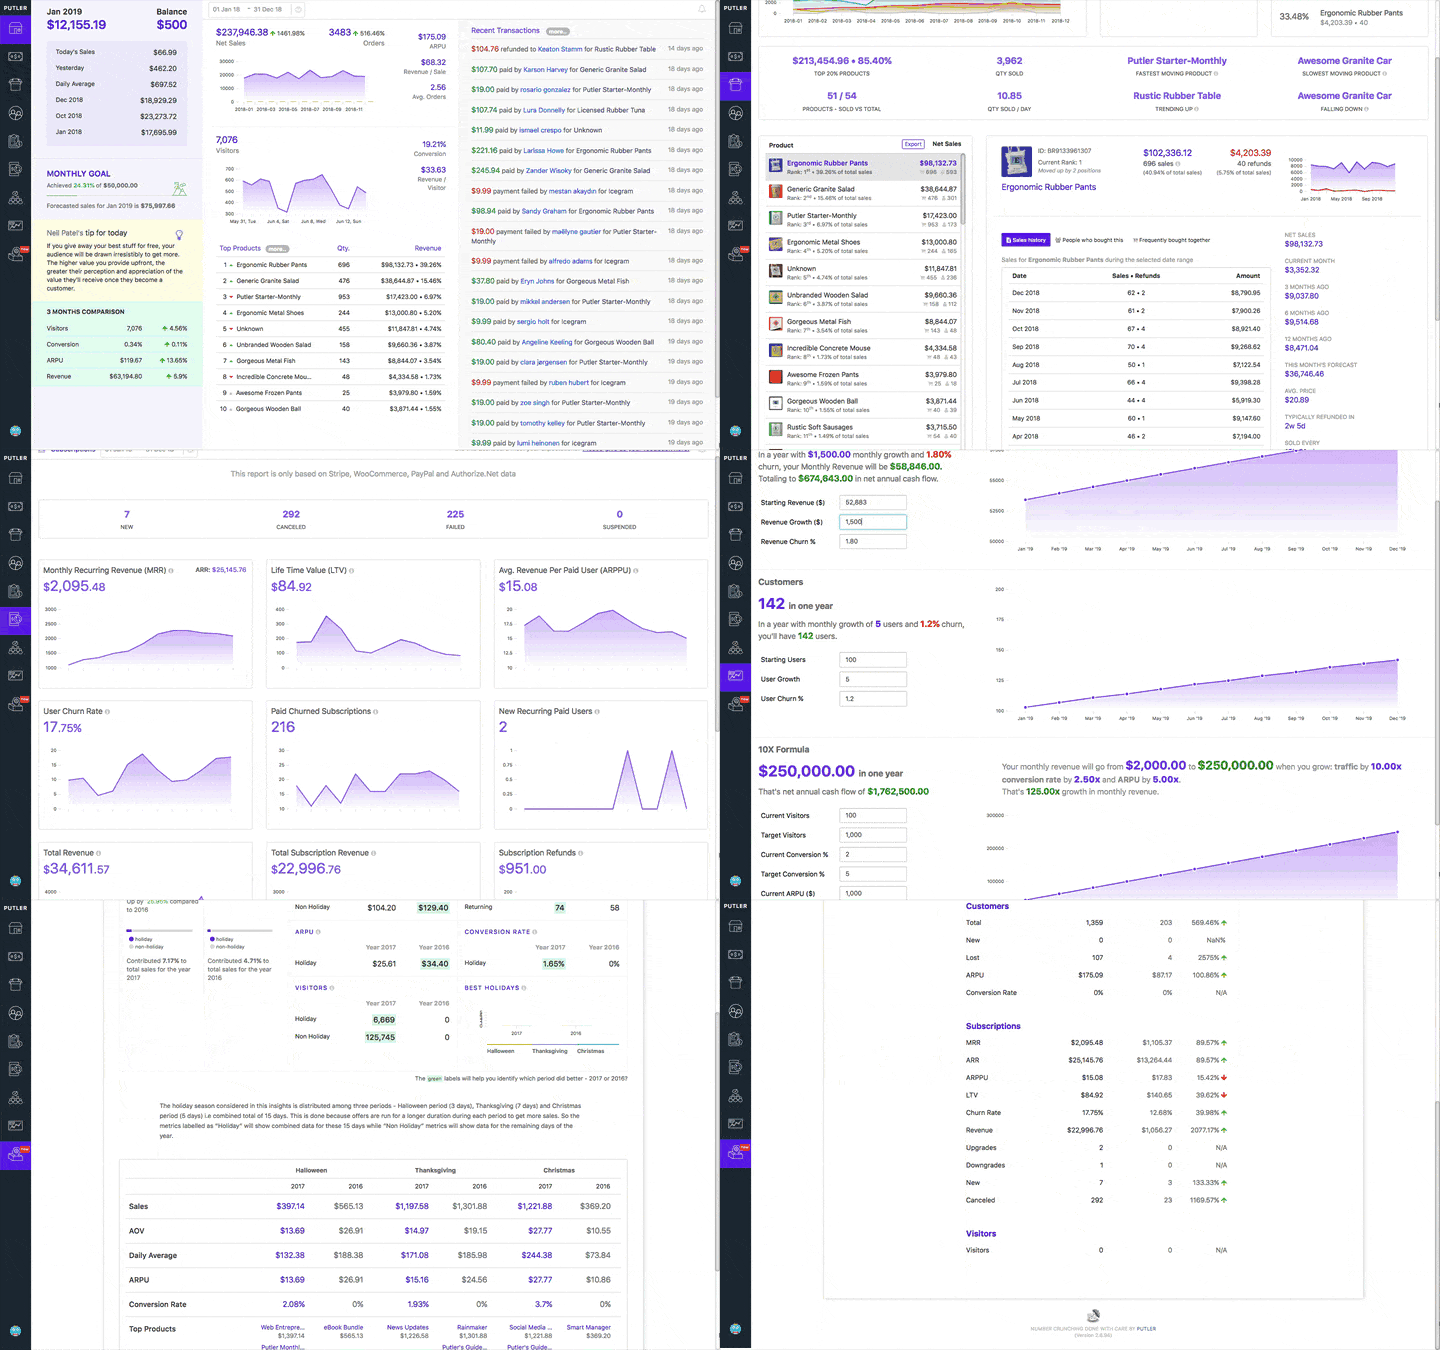
Putler has 9 dashboards. Each of which serves a separate purpose and provides a distinct report. Here’s a quick overview of each.
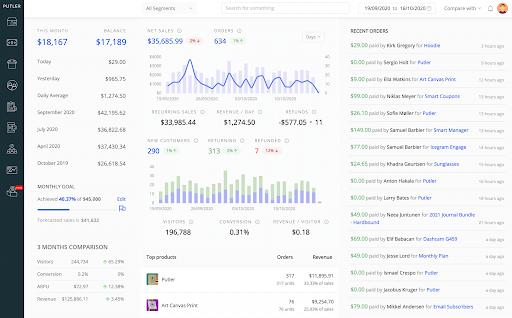
Home dashboard – It provides an overview of your entire business. You can track revenue, trends, forecast monthly sales, view real-time transactions on your store, top 10 products, 3-month visitor comparison, sales chart, visitor chart.
Sales Dashboard – This dashboard provides you complete reports on your store’s sales. You can view the sales chart, sales breakdown for various periods, sales heatmap, use predefined sales filters to filter data (like – location, products, amount range, status), export sales CSV, and a lot more.
Products Dashboard – For running a successful business, you need to have a handle on your products. Products Dashboard provides you with all the information you need to know about your products. You get the Top 20% vs Rest of the Products chart, product purchase breakdown, product-specific filters (like – number of customers, quantity sold, refund percent, average pricing, and attributes( for variation products)). Putler also provides an in-depth view of each of the products.
Customer Dashboard – This dashboard will give you information about your customers. Similar to the Sales dashboard it also provides you a chart but this is customer-specific (new vs returning), customer number breakdown, customer CSV, in-depth customer card, customer-centric filters (like location, products, customer since, revenue contribution, customer type, the total number of orders).
Transactions Dashboard – This is similar to the Sales dashboard but it also provides ‘Fees’ and ‘Tax’ information that it pulls from the payment gateways end.
Subscriptions Dashboard – Suppose you have a subscription product, Putler will recognize it and will show you SaaS metrics for all your subscription products. You can check out the MRR, ARR, ARPU, Churn, trials, downgrades, upgrades and a lot more.
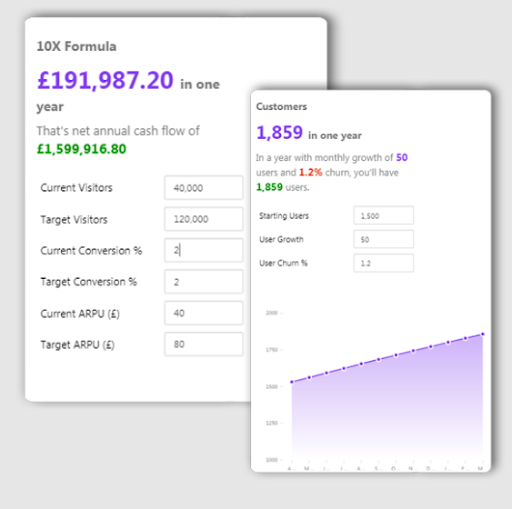
Time Machine Dashboard – This is the forecasting dashboard. It allows you to forecast revenue, customers and the 10X growth of your business. You can use this dashboard when you are planning for the next quarter, scheduling tasks for your team, setting goals.
Audience Dashboard – This dashboard pulls in information from Google Analytics. It provides you metrics, charts and reports based on website traffic, search terms, device usage and a lot more.
Insights Dashboard – This dashboard provides you two types of reports:
1. Holiday Season Insights – It gives you a year-on-year comparison of how your store performs during the Holidays vs The Non-Holiday days. You can easily pull up numbers, look at the recommendations and plan for the upcoming Holiday season.
2. Performance comparison – You can compare the performance of your single store/multiple stores across various time periods and look at all the metrics in a single glance.
Now that the dashboards are done, let’s look at some important features within Putler.
Customer segmentation
Email marketing is one important aspect for all online businesses. But as proven by experts you need to send segment customers and send them targeted emails. Putler helps you achieve that.
It helps you segment customers based on various factors like:
- RFM Analysis
- Location
- Price sensitivity
- Product purchased
- When they first signed up
- New/Returning customers
- Subscription status- completed, refunded, disputed, failed.
Putler lets you segment customers based on these factors and lets you export them as CSV.
Forecasts & Planning
Putler helps you forecasts in multiple ways. Firstly, Putler helps to forecast your monthly sales. It takes various parameters into consideration like sales of the last 3 months + sales of the current month in last year. It takes an average of this and predicts your currents month sales.
Also as mentioned above, the Time Machine Dashboard helps forecast revenue, customers, 10X growth of your business based on various factors.
You can use the revenue and customer forecasts while planning for the upcoming month/quarter/year. The numbers shown in the forecast can be kept as benchmarks and the they can be used to compare the actual performance from time to time.
Multistore Reporting
If you have multiple websites/multiple stores/ multiple Amazon shops/ Shopify shops etc. Then Putler is a must-have for you.
You can connect all your stores within Putler and view both consolidated reports from all your stores or create separate views for each store and view reports for each store individually.
Manage Subscriptions and Process Refunds
If you have PayPal/Stripe/Shopify connected to Putler you can process refunds, and manage subscriptions right from within Putler itself.
The benefit of doing this: You need not share critical credentials with your support team. You can simply provide them Support team access and they can carry out the operation using Putler.
Identify Products that are Frequently Bought Together
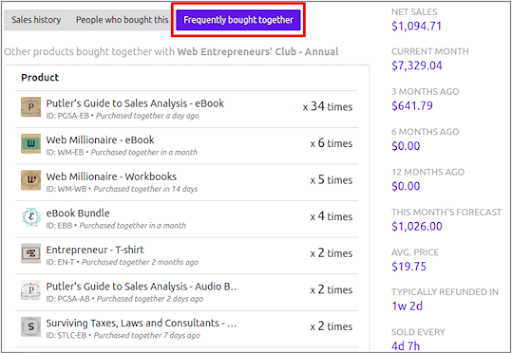
Putler provides you insights into the products that are frequently bought together.
It shows you the frequency of how many times a product has been bought together with another product. This insight helps you plan offer funnels on your store, it helps you send out relevant product upsell emails, and helps increase the ROI of your business.
Unlimited Filters – Products, Customers, Orders
Putler allows you to filter and segment your data in multiple ways.
It has well-thought filters on every dashboard. Plus, if you wish to create a custom segment, you can create it and save it for future use as well.
Some examples of filters provided by Putler-
1. Location
2. Order status
3. Customer type
4. Customer since
5. RFM customer segmentation
6. Revenue contribution and a lot more
Explore all the filters here.
Over to you
Putler is a simple multi-channel analytics and insights tool. It provides you metrics for both Saas as well as eCommerce businesses. It has a 14-day FREE trial. So do give Putler a try!
Go sign up for Putler today!

